Analysis
The frame "Analysis" displays the analysis results. The frame contains six buttons to show them:
Kh + pressures
Variation of the modulus of subsoil reaction is displayed in the left part of the desktop (by default, a blue color with hatching). In a method of depending pressures, some of the springs (values of modules of subsoil reaction) are removed from the analysis (spring stiffness is equal to zero). If all springs are out, the analysis may fail to converge. The program exists without finding a solution. An error message appears in the bottom part of the frame. It is necessary to change the construction - e.g., add an anchor, change a depth of excavation, improve soil parameters, etc.
Some construction stages display (by default, a yellow dotted line is assumed) deformation at the onset of mobilization of the earth pressure at rest - this is a complementary information showing plastic deformation of a structure.
Distributions of limiting pressures (by default, a green dashed line is assumed) are presented in the right part of the window (passive pressure, pressure at rest and active pressure). The actual pressure acting on a structure is plotted in a solid blue line.
Both deformed (by default, a solid red color is assumed) and undeformed structure appears in the right part of the desktop. Forces and displacements developed in anchors, supports and props are also shown.
Internal forces
Plot of a structure with forces acting in anchors, reactions and deformations of supports, and props appear in the left part of the desktop. Distributions of bending moment and shear force are then plotted on the right.
Displacement + Stress
Plot of a structure with forces acting in anchors, reactions and deformations of supports, and props appear in the left part of the desktop. The deformed shape of a structure with overall pressure acting on a sheeting structure is then plotted on the right.
Terrain settlement
Plot of a structure is displayed in the left part of the desktop. Terrain settlement is plotted on the right. Method for calculation of terrain settlement is selected in the upper part of frame.
Utilization of Passive Pressure
Plot of a structure is displayed in the left part of the desktop. Distributions of limit pressures and actual pressure acting on a structure are presented in the right part of the window. Safety factor for utilization of passive pressure is inputted in the upper part of the frame.
Vertical capacity
Plot of a structure is displayed in the left part of the desktop. Distributions of limit pressures and actual pressure acting on a structure are presented in the right part of the window. Parameters for vertical bearing capacity are inputted in the upper part of the frame.
Overturning
Plot of a structure is displayed in the left part of the desktop. Distributions of limit pressures, actual pressure acting on a structure, and its deformation are presented in the right part of the window. The resultant active and passive forces and the position of the pivot point are also shown. The safety factor for overturning is inputted in the upper part of the frame.
Providing the modulus of subsoil reaction is found by iteration it is necessary to check the course of manual iteration in the dialog window "Iteration". Details are provided in the theoretical part of the help, chapter "Modulus of subsoil reaction determined by iteration".
In the case of double-row wall, it is possible to show internal forces, displacement, and stress on the front or back row.
Visualization of results can be adjusted in the frame "Drawing Settings".
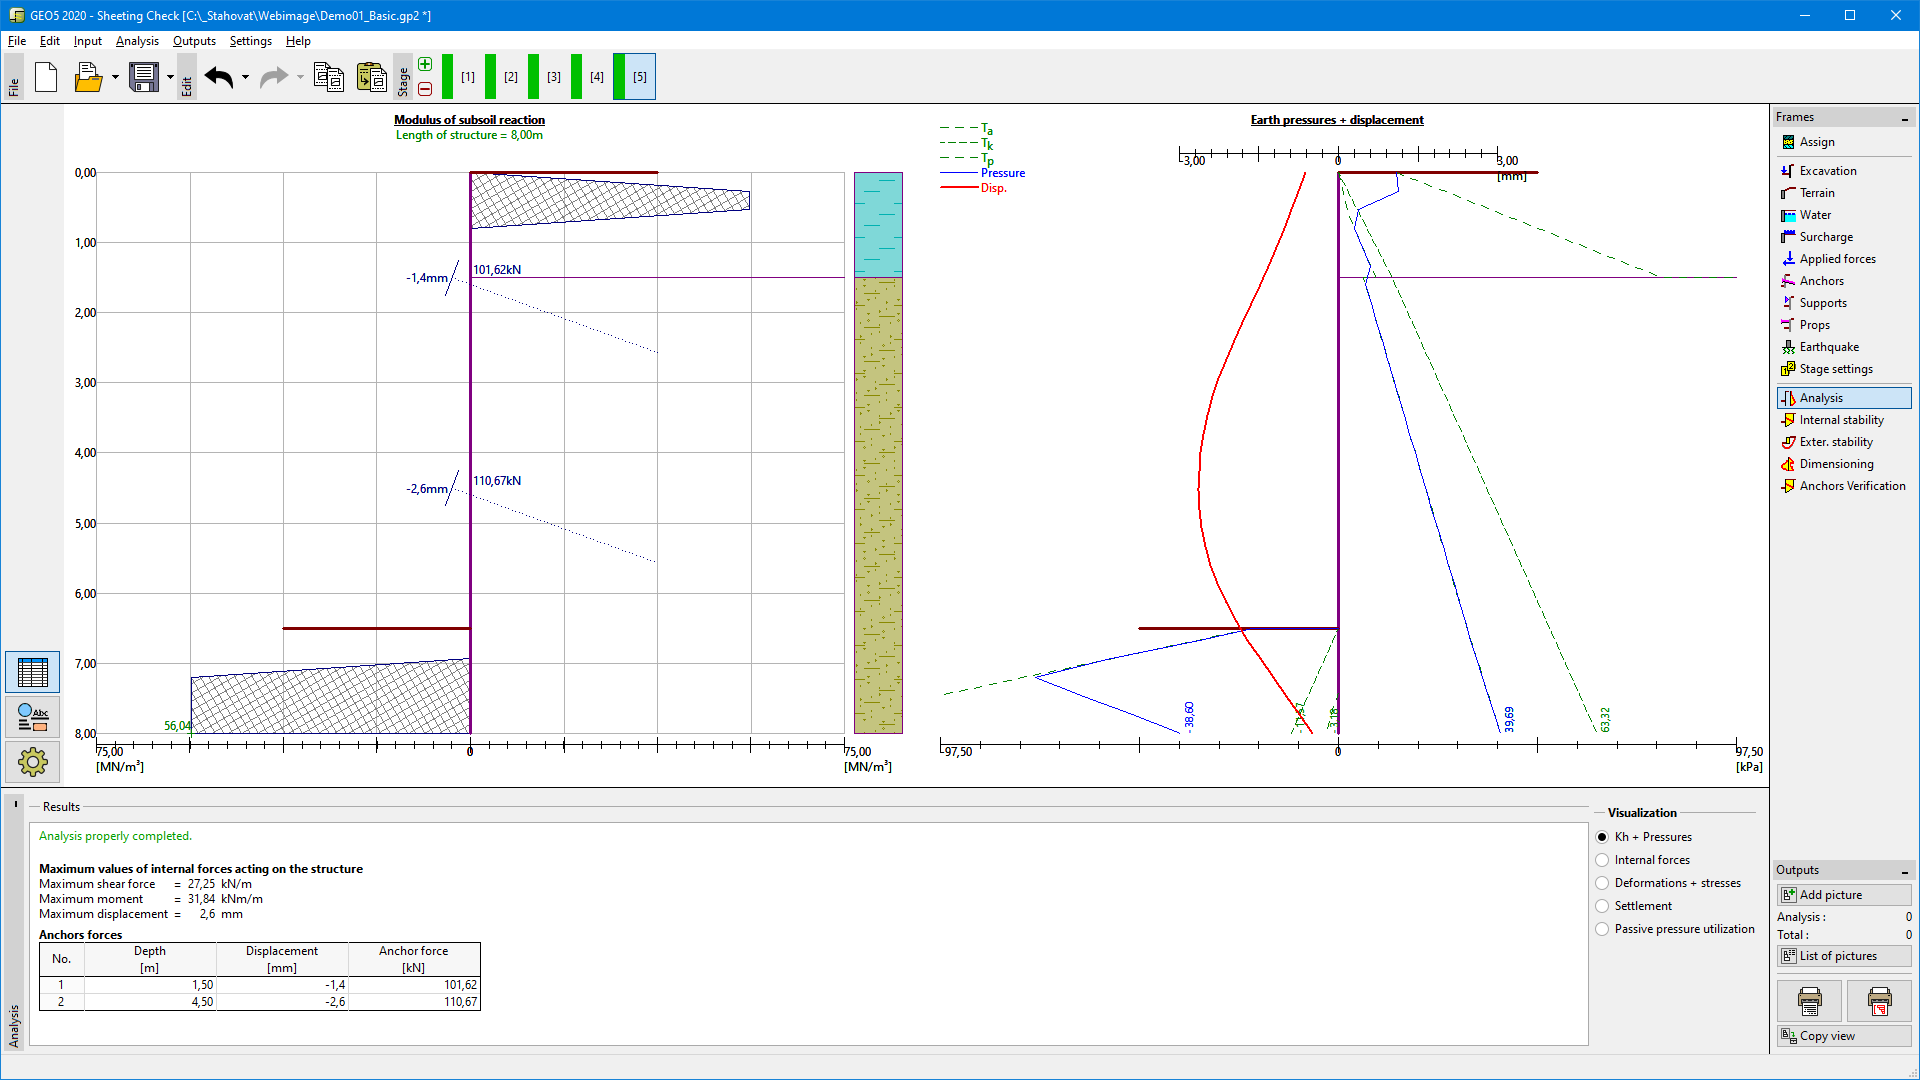 Frame "Analysis" - modulus of subsoil reaction, earth pressures and displacement
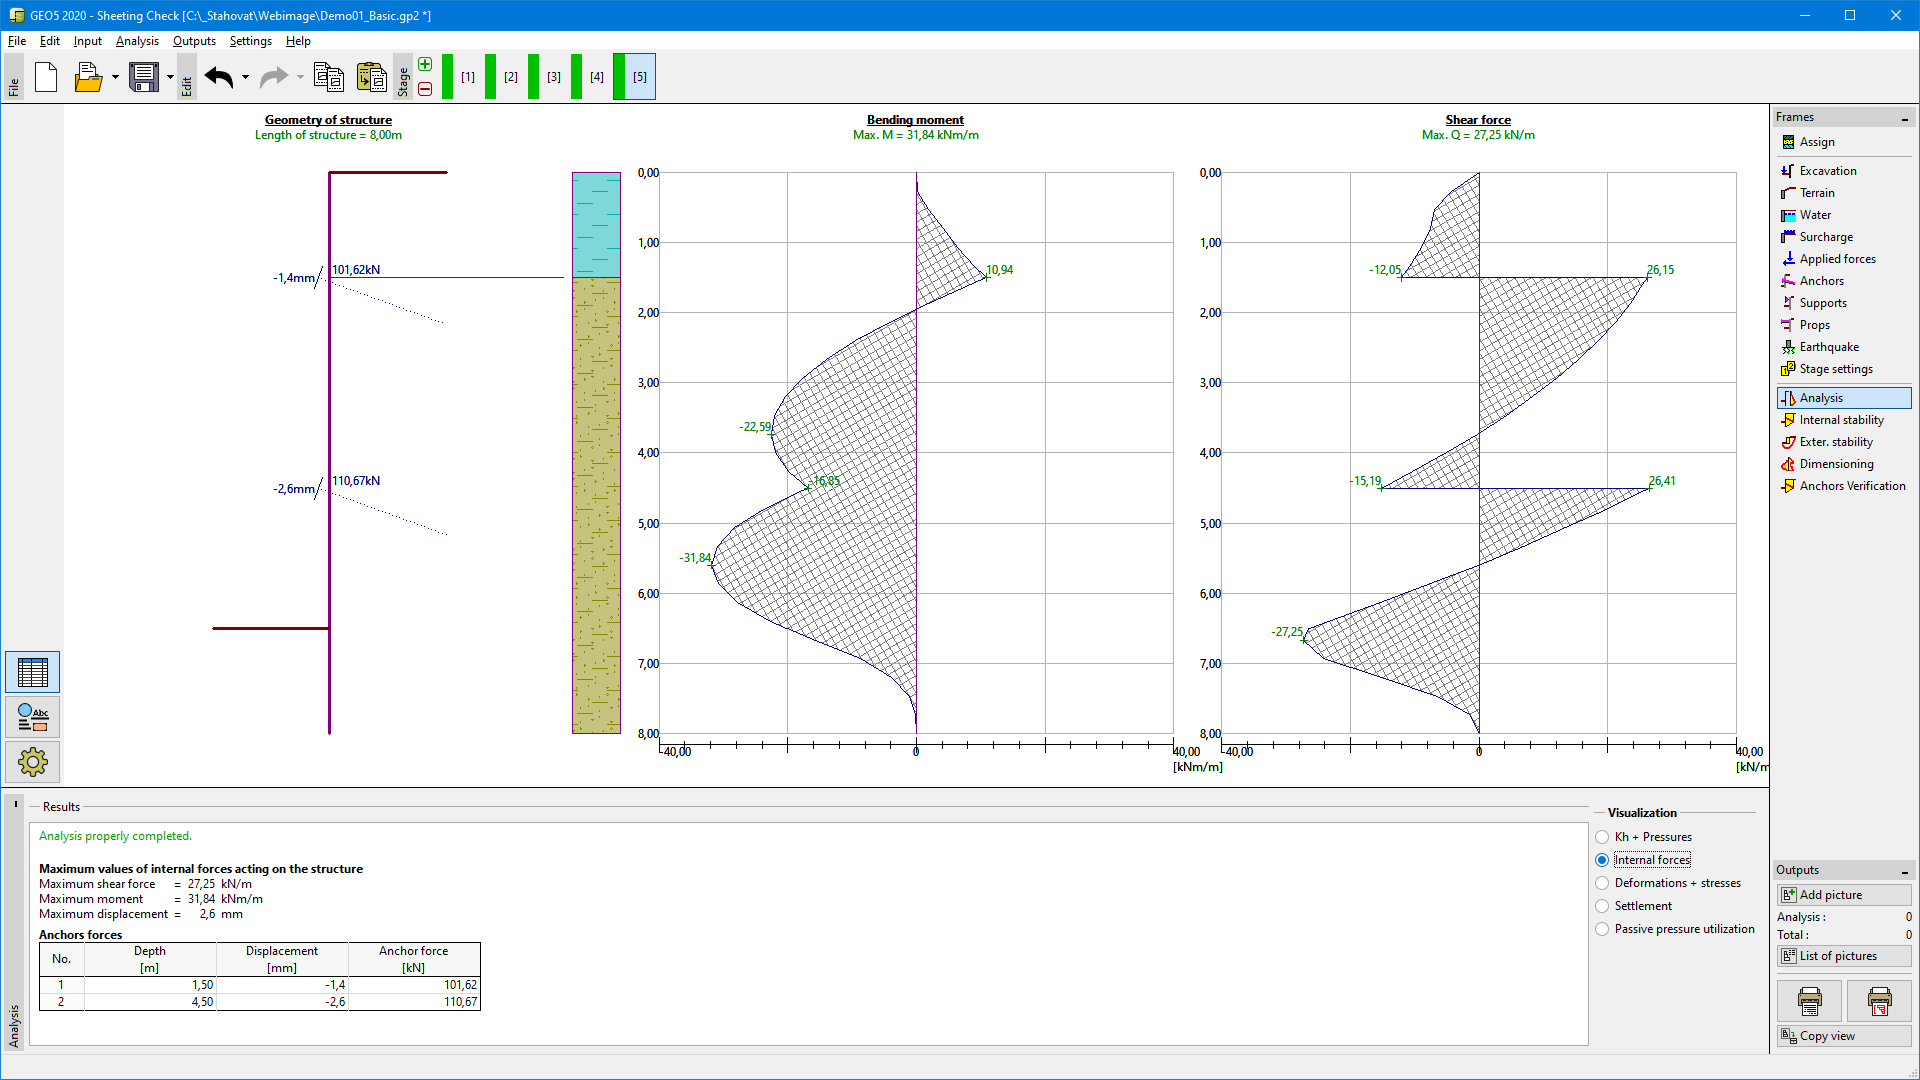 Frame "Analysis" - bending moment and shear force
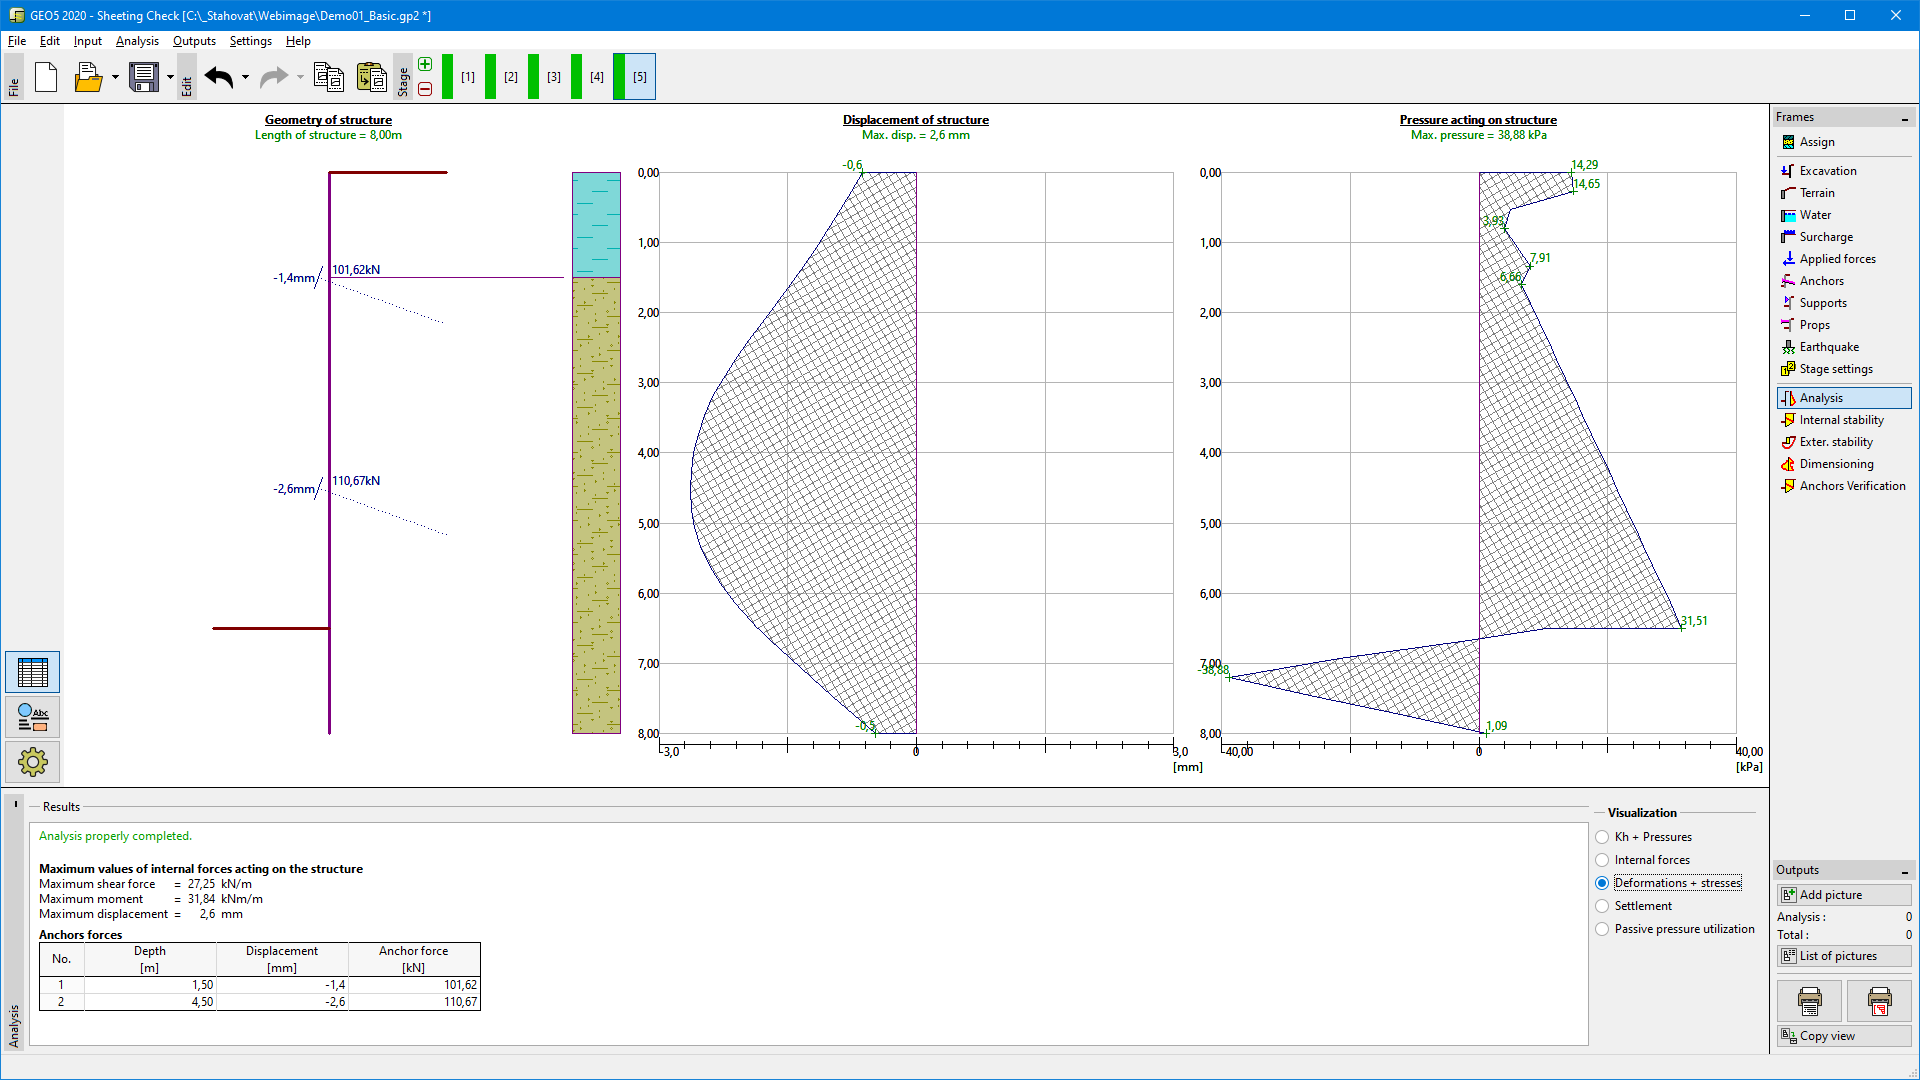 Frame "Analysis" - displacement and earth pressure acting on a structure
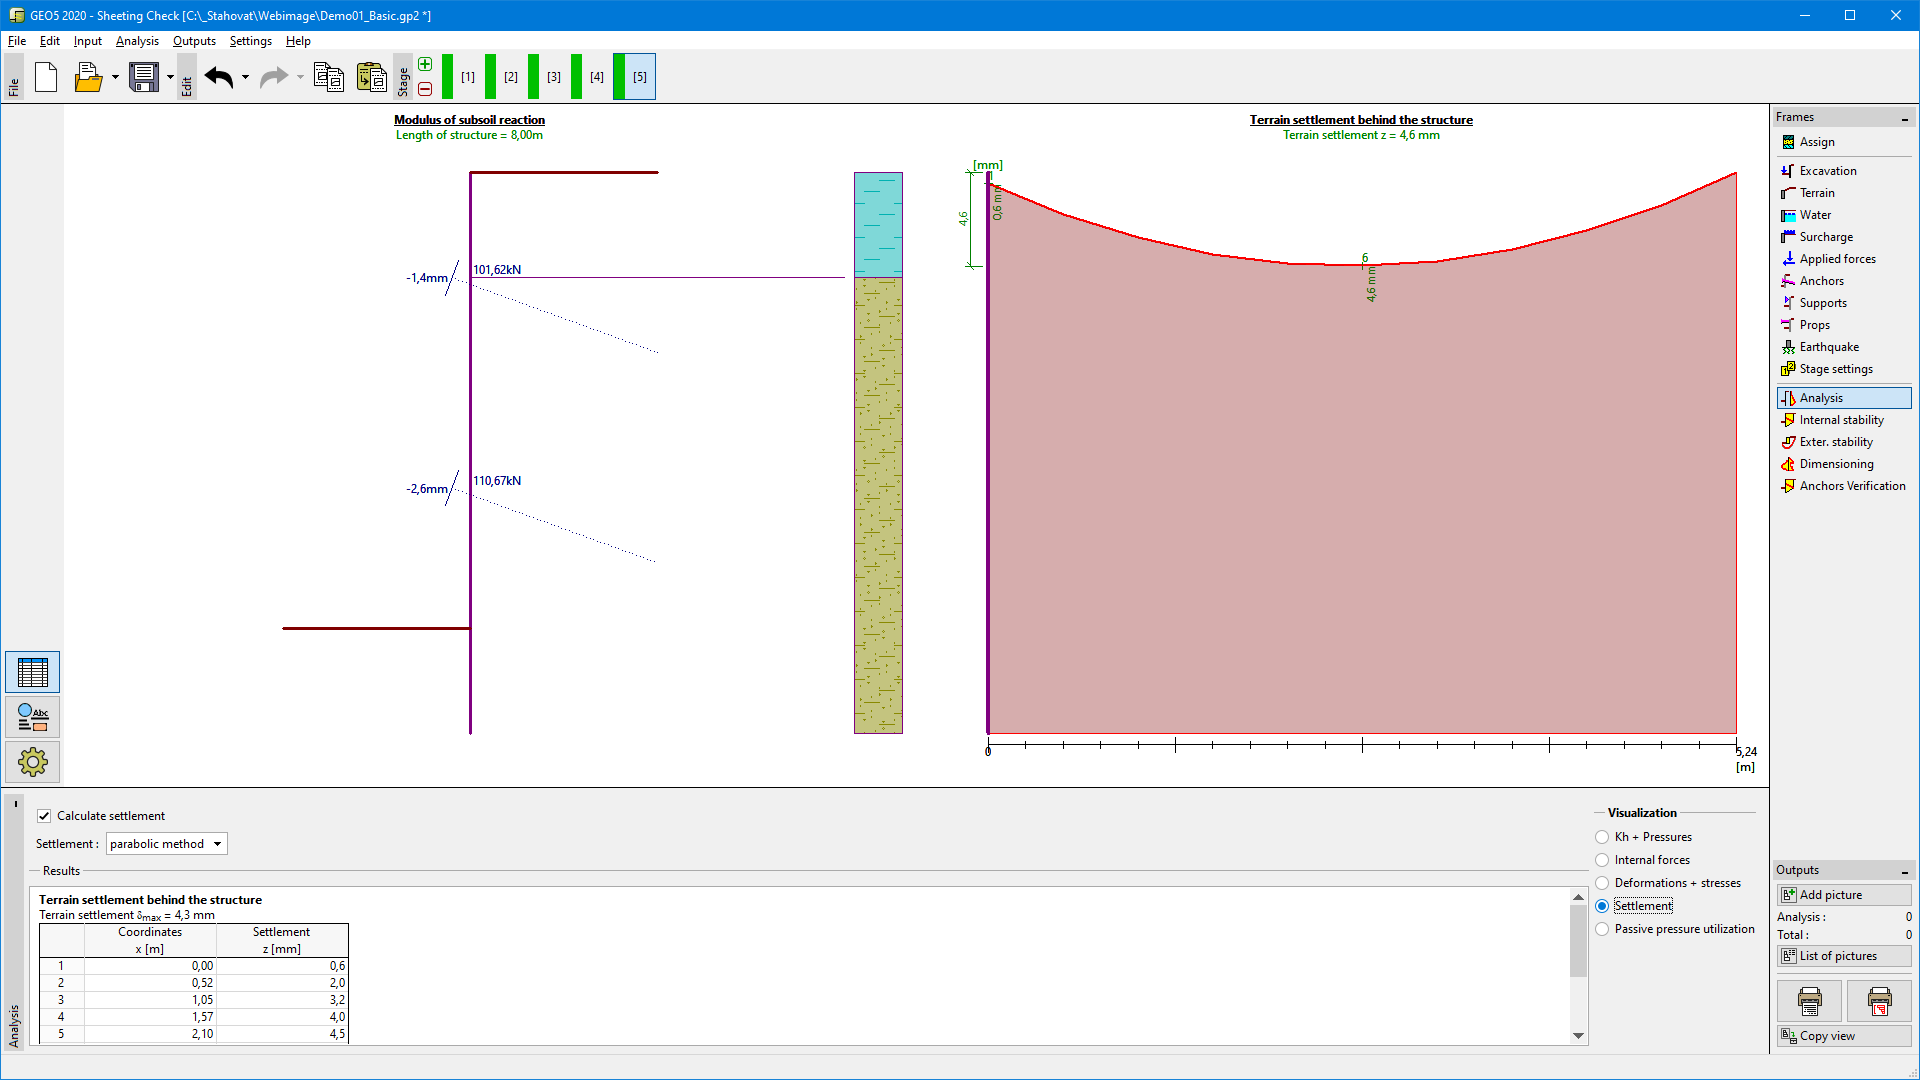 Frame "Analysis" - terrain settlement
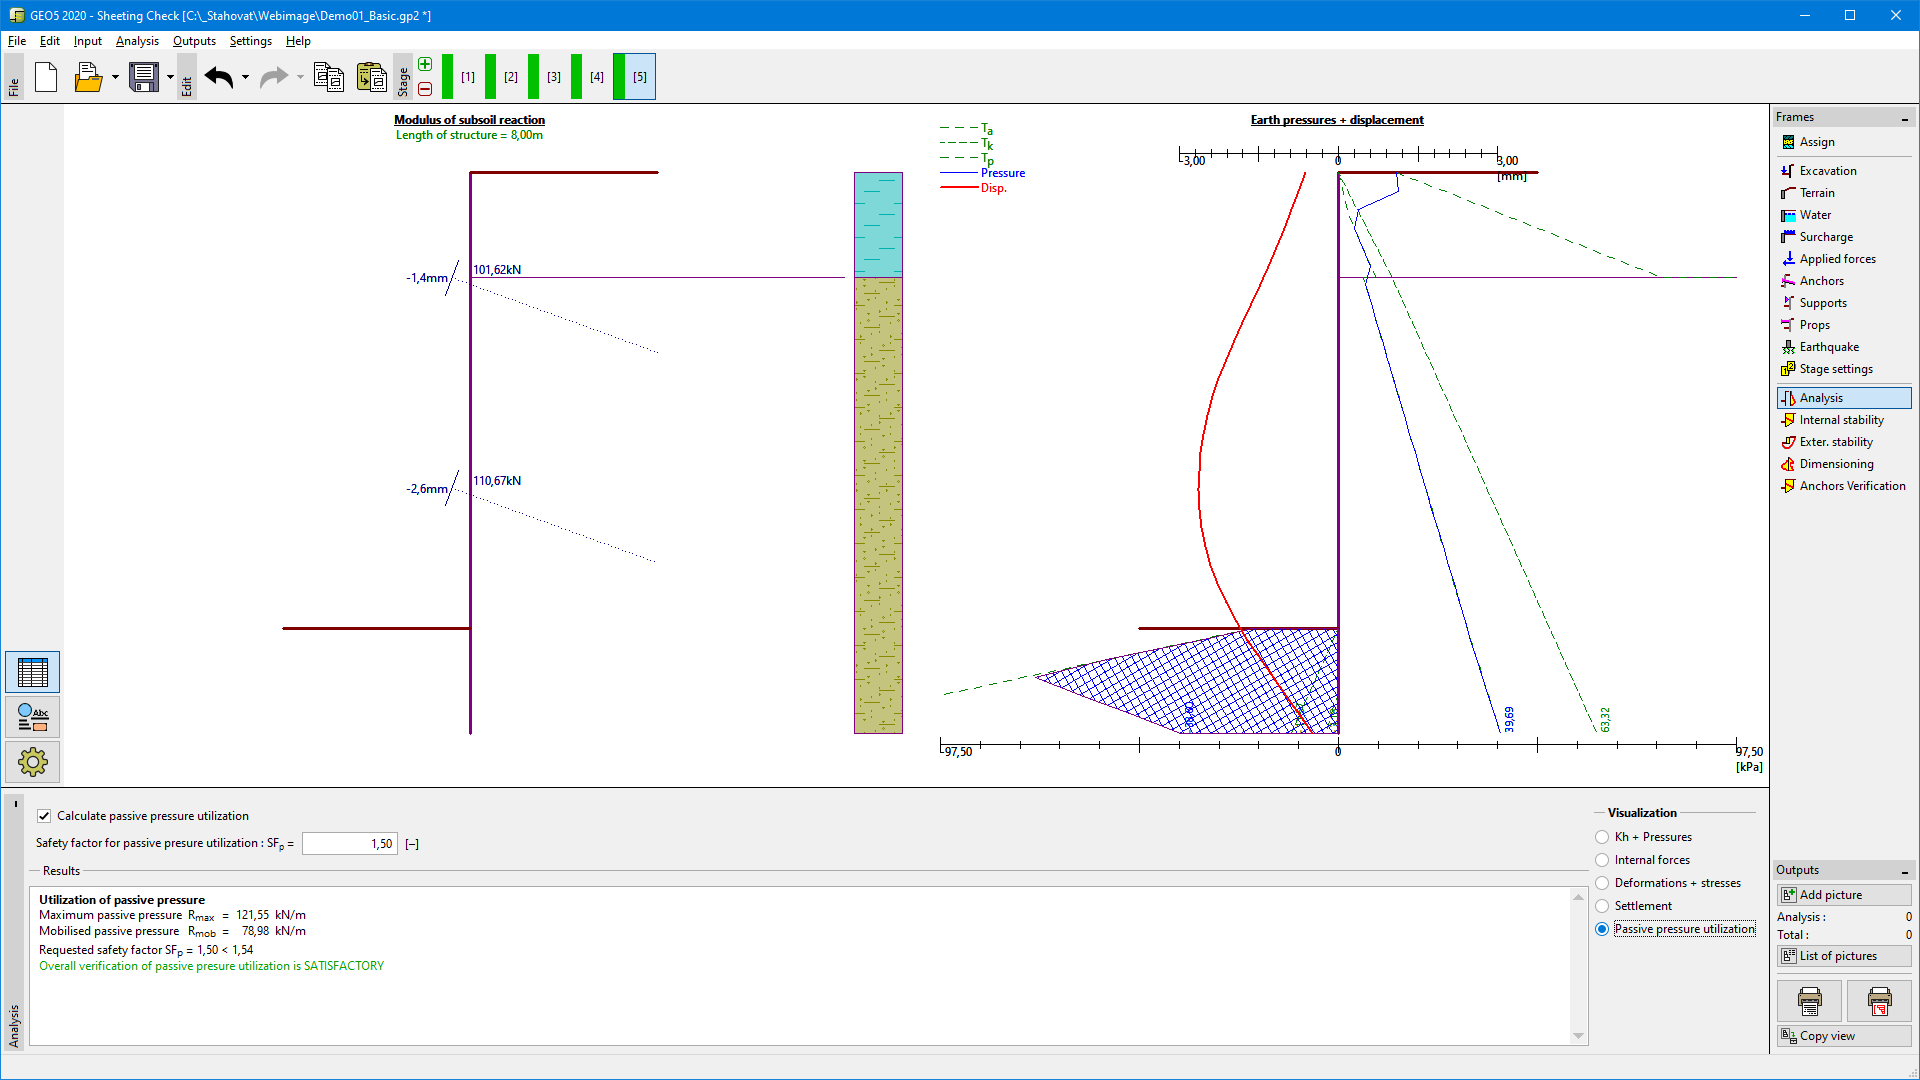 Frame "Analysis" - Utilization of the passive pressure
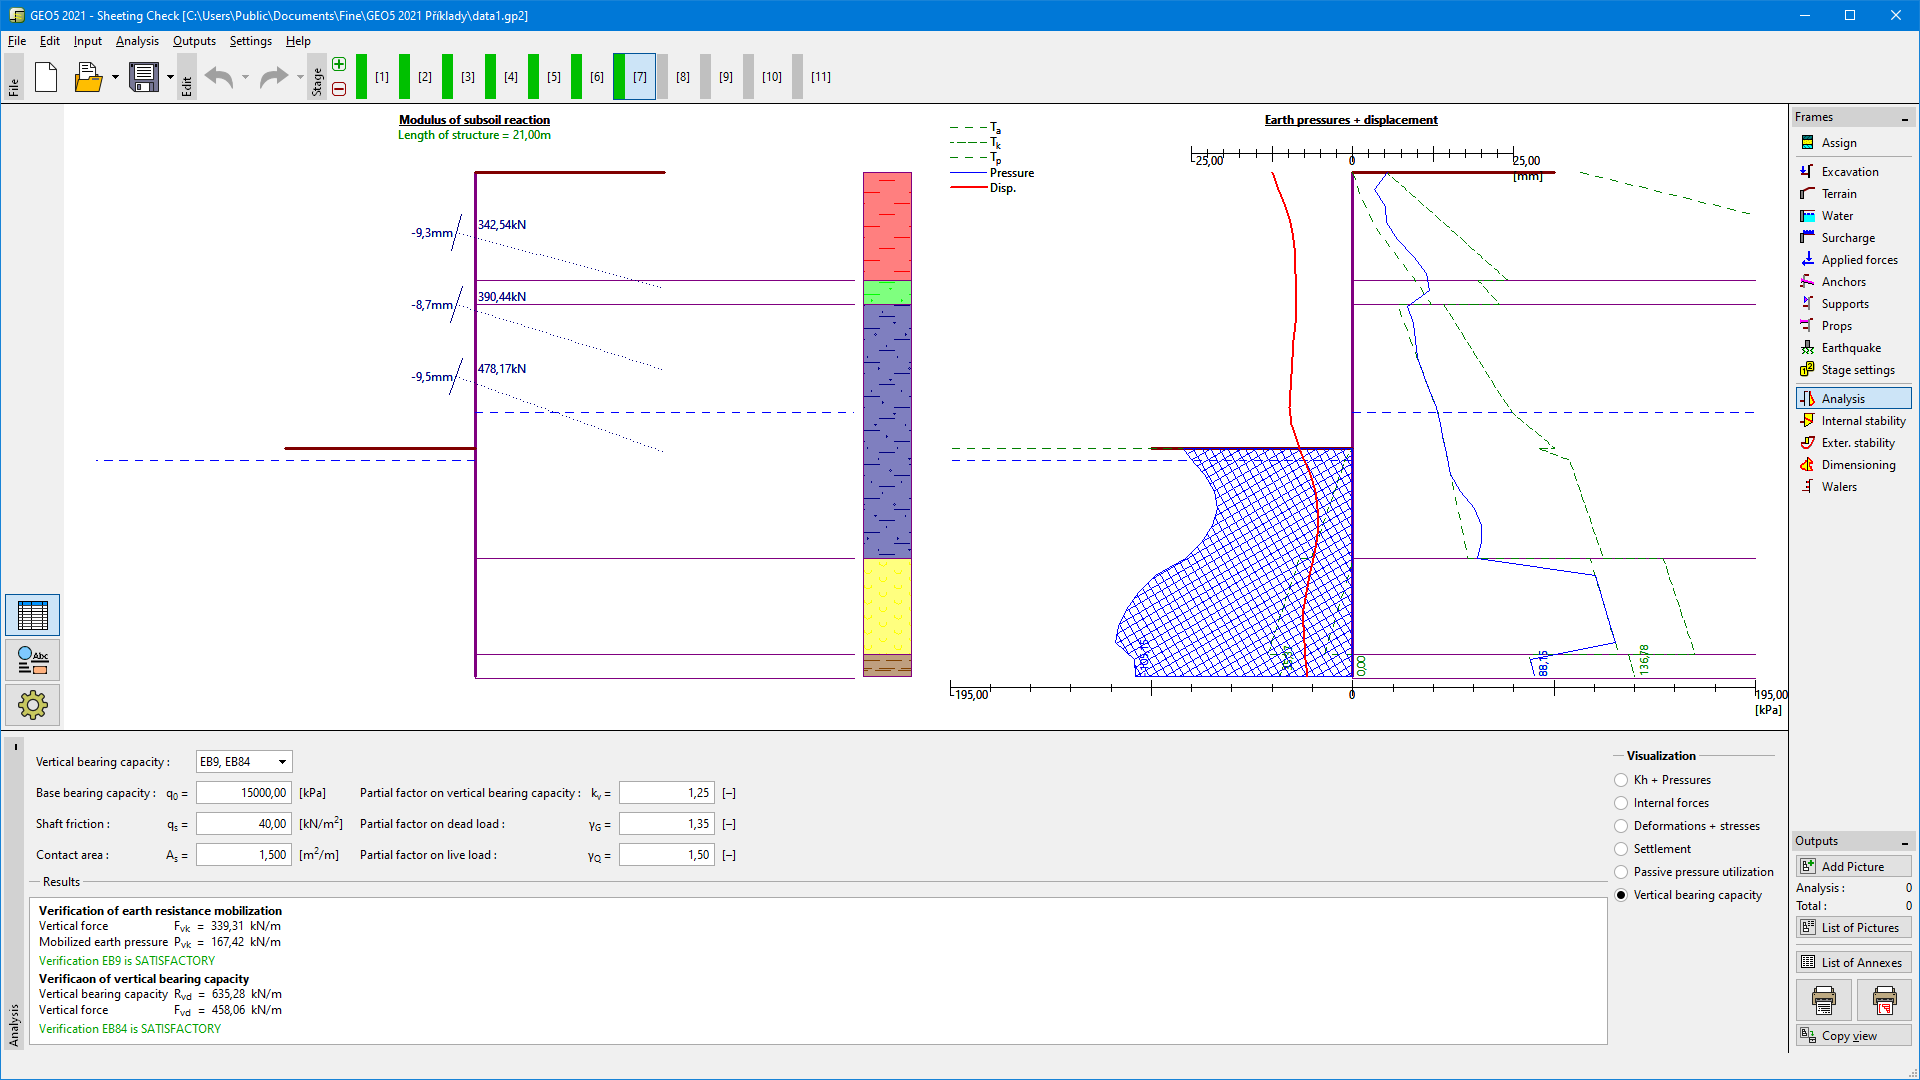 Frame "Analysis" - Vertical bearing capacity
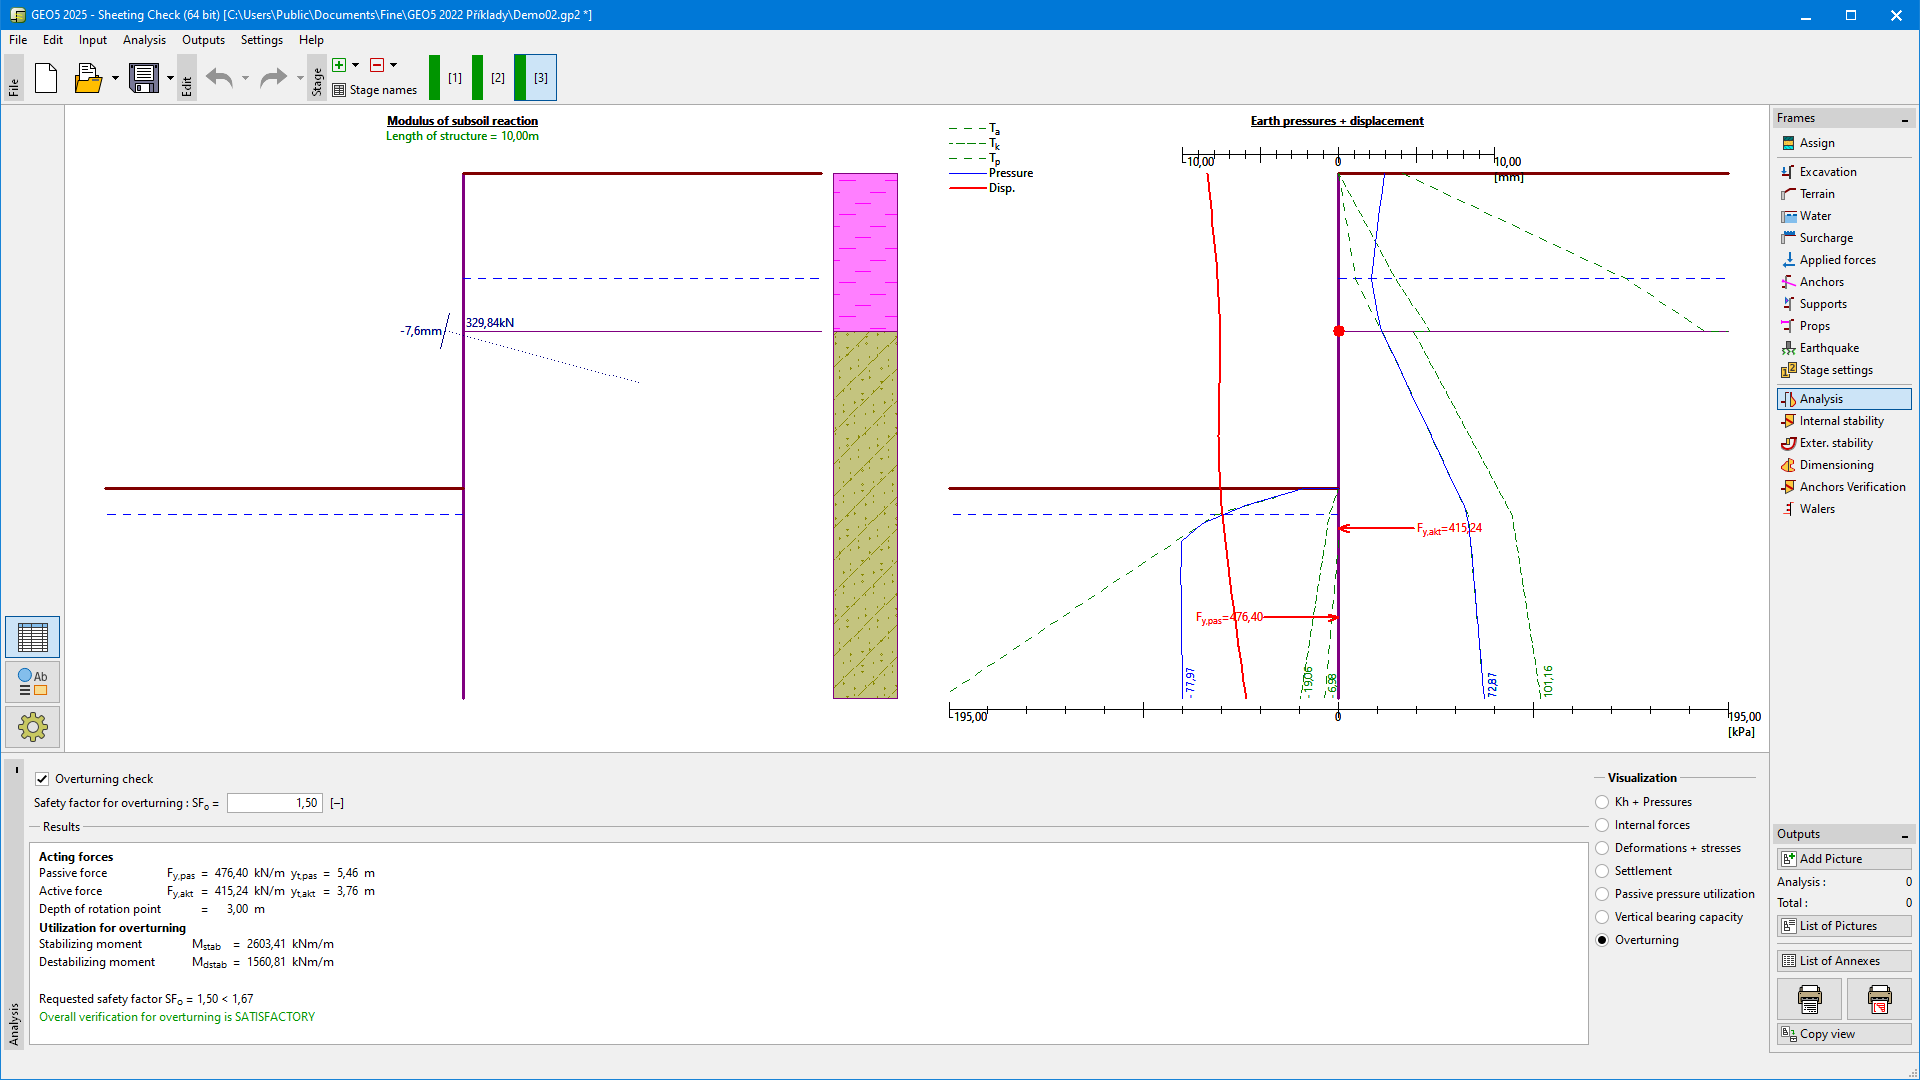 Frame "Analysis" - Overturning