Display of Points
The point cloud is made up of data that were acquired as part of the field measurements (e.g. laser scanning with LiDAR). Individual points can be displayed using:
- RGB - corresponds to the real color of the point - produces an orthophoto-like display (not all point clouds must contain information about the correct color of individual points)
- LiDAR intensity - displays the intensity of reflection from the measured environment (information is only available in point clouds from LiDAR scanning)
- Elevation - display according to z-coordinate
The display of LiDAR intensity or altitude can be adjusted by setting a color scale.
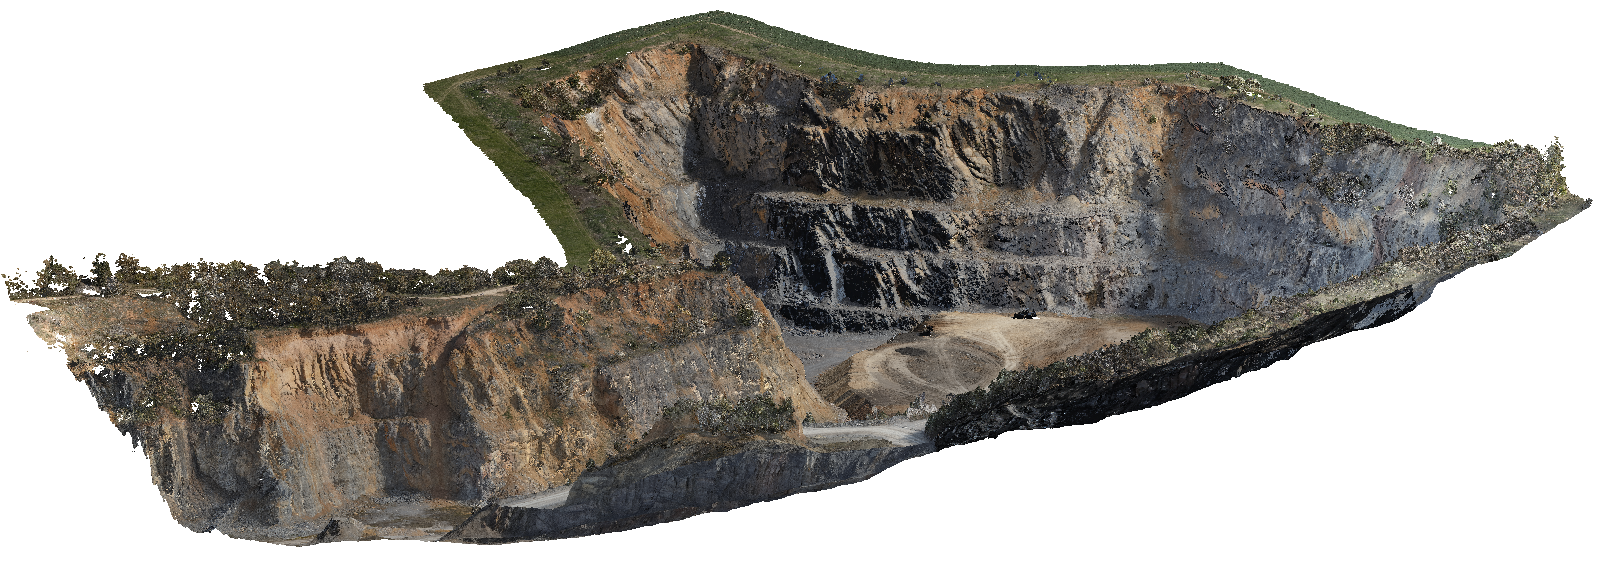 RGB display
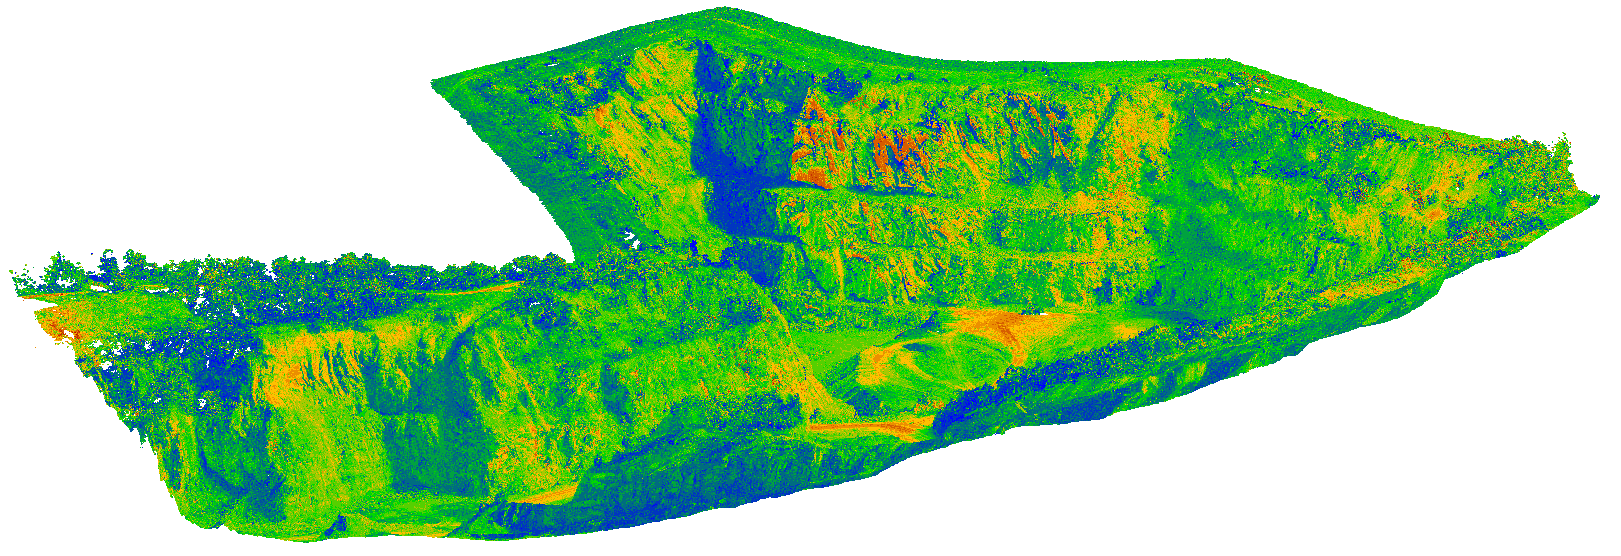 Display of lidar intensity
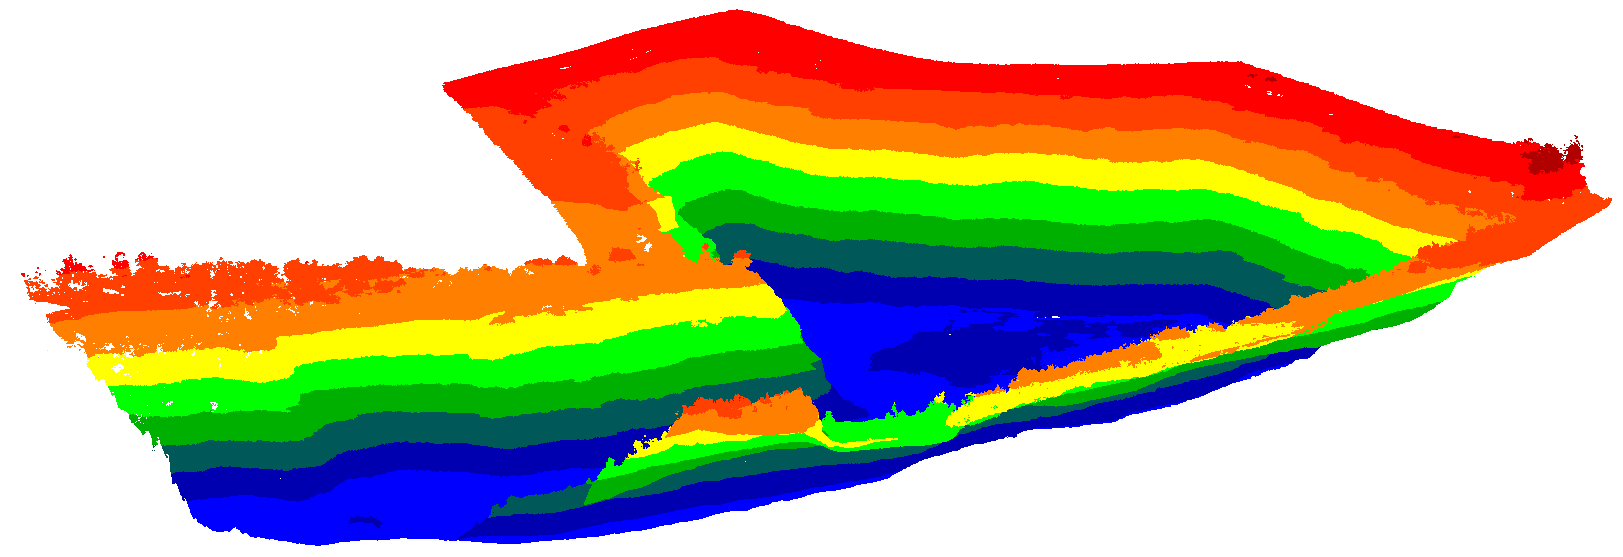 Elevation display