Material Models in Flow Analysis
The steady state flow analysis is driven by Darcy’s law specifying the relationship between the flow velocity and the gradient of hydraulic head. The current version of the program assumes constant values of coefficients of permeability independent of pore pressure.
The program also requires specifying the initial void ratio e0 for the determination of the current porosity n and subsequently the actual velocity of water flowing through pores only vs = v/n, where v is the average flow velocity through the entire seepage area. Generally, the void ratio e0 = 1 corresponds to soil porosity of n = 50%.
By introducing the coefficient of relative permeability Kr the program allows for tracking the transition zone between fully saturated (S = 1, Kr = 1) and unsaturated (Kr => 0) region of the soil body. As an example we may consider the problem of unconfined flow. The process of tracking the transition zone is governed by one of the three models of transition zone determining the evolution of coefficient of relative permeability Kr as a function of pore pressure head, see Figures.
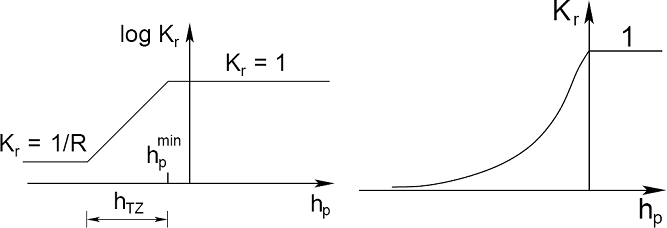 (a) Log-linear model [1], (b) Van Genuchten model [2]
Log-linear model
The Log-linear transition zone model described e.g. in [1] is defined by the following parameters:
hpmin | - | minimum value of pressure head in fully saturated region [kPa] | |
hTZ | - | transition zone width [m] | |
R | - | reduction parameter, a sufficiently large number R = 100 až 1000 [-], default setting assumes R = 1000 [-] |
The coefficient of relative permeability Kr is given by:
![]()
Gardner model
This is an equivalent model depending on a single parameter α [1/m] only. The coefficient of relative permeability Kr is in this case given by [4]:
![]()
Van Genuchten model
In this case, the value of coefficient of relative permeability Kr is given by:

where α [1/m], n > 1, m = 1 - 1/n are model parameters. Their values can be obtained from laboratory measurements of retention curves approximated by:
![]()
![]()
where: | Ssat | - | degree of saturation of fully saturated soil, default setting Ssat = 1 |
Sr | - | residual degree of saturation | |
Θ | - | normalized water content |
Parameter Θ is in general provided by:
![]()
where: | θr | - | residual water content [m3/m3] |
θS | - | water content of fully saturated soil [m3/m3] |
The current degree of saturation S can be expresses as a ratio of the water content θ and porosity n as follows (it is necessary to distinguish between n representing porosity and n, which appears in the van Genuchten model, they are two different variables):
![]()
The Log-linear and Gardner models adopt a simplified version of the van Genuchten model according to [5]:
![]()
where b > 0 [-] is a fitting parameter allowing for a better approximation of the retention data of a given soil.
We recommend the following tables of parameters which are actually used in the program. These parameters are derived from those given in the original tables.
Optimal values of parameters of the van Genuchten model for various classifications based on USDA and FAO are presented in the following tables.
Table with regression coefficients for grain size USDA according to Van Genuchten (1991)
Soil (grain size) | Ksat [m/day] | RETC | Rosetta | ||||||
e [-] | Sr [-] | α [1/m] | n [-] | e [-] | Sr [-] | α [1/m] | n [-] | ||
Sand | 7.13 | 0.75 | 0.11 | 14.5 | 2.68 | 0.60 | 0.14 | 3.5 | 3.18 |
Loamy sand | 3.50 | 0.70 | 0.14 | 12.4 | 2.28 | 0.64 | 0.13 | 3.5 | 1.747 |
Sandy loam | 1.06 | 0.70 | 0.16 | 7.5 | 1.89 | 0.63 | 0.10 | 2.7 | 1.448 |
Loam | 0.25 | 0.75 | 0.18 | 3.6 | 1.56 | 0.66 | 0.15 | 1.1 | 1.474 |
Silt | 0.06 | 0.85 | 0.07 | 1.6 | 1.37 | 0.96 | 0.10 | 0.7 | 1.677 |
Silt loam | 0.11 | 0.82 | 0.15 | 2.0 | 1.41 | 0.78 | 0.15 | 0.5 | 1.663 |
Sandy clay loam | 0.314 | 0.64 | 0.26 | 5.9 | 1.48 | 0.62 | 0.16 | 2.1 | 1.33 |
Clay loam | 0.062 | 0.70 | 0.23 | 1.9 | 1.31 | 0.79 | 0.18 | 1.6 | 1.415 |
Silty clay loam | 0.017 | 0.75 | 0.21 | 1.0 | 1.23 | 0.93 | 0.19 | 0.8 | 1.52 |
Sandy clay | 0.029 | 0.61 | 0.26 | 2.7 | 1.23 | 0.63 | 0.30 | 3.3 | 1.207 |
Silty clay | 0.0048 | 0.56 | 0.19 | 0.5 | 1.09 | 0.93 | 0.23 | 1.6 | 1.321 |
Clay | 0.048 | 0.61 | 0.18 | 0.8 | 1.09 | 0.85 | 0.21 | 1.5 | 1.253 |
Table with regression coefficients for grain size FAO according to Van Genuchten (1998)
Soil (grain size) | Ksat [m/day] | e [-] | Sr [-] | α [1/m] | n [-] |
Top soil (up to depth 1 m) | |||||
Coarse (C) | 0.600 | 0.68 | 0.062 | 3.83 | 1.3774 |
Medium (M) | 0.121 | 0.78 | 0.023 | 3.14 | 1.1804 |
Medium fine (MF) | 0.023 | 0.75 | 0.023 | 0.83 | 1.2539 |
Fine (F) | 0.248 | 1.08 | 0.019 | 3.67 | 1.0120 |
Very fine (VF) | 0.150 | 0.78 | 0.016 | 2.65 | 1.1033 |
Soil at depth (> 1 m) | |||||
Coarse (C) | 0.700 | 0.58 | 0.068 | 4.30 | 1.5206 |
Medium (M) | 0.108 | 0.65 | 0.026 | 2.49 | 1.1689 |
Medium fine (MF) | 0.040 | 0.70 | 0.024 | 0.82 | 1.2179 |
Fine (F) | 0.085 | 0.93 | 0.021 | 1.98 | 1.0861 |
Very fine (VF) | 0.082 | 1.17 | 0.019 | 1.68 | 1.0730 |
Table: FAO texture classification system
Soil | Definition |
Coarse (C) Medium (M) | clay < 18% and sand > 65% 18%< clay < 35% and 15%< sand or: clay < 18% and 15%< sand < 65% |
Medium fine (MF) | clay < 35% and sand < 15% |
Fine (F) | 35%< clay < 60% |
Very fine (VF) | 60%< clay |
Literature:
Details can be found in [2].
[1] D.M. Potts, L. Zdravkovič, Finite element analysis in geotechnical engineering - theory, Thomas Telford, London, 1999.
[2] M. Th. Van Genuchten, A closed formulation for predicting the hydraulic conductivity of unsaturated soils, Journal Soil Science Society of America 44, 239-259, 1988..
[3] M. Šejnoha, Finite element analysis in geotechnical design, to appear (2015)
[4] W. R. Gardner, Some steady-state solutions of the unsaturated moisture flow equation to evaporation from a water table, Soil Science 85(4), 228-232, 1958.
[5] M. Šejnoha, T. Janda, H. Pruška, M. Brouček, Metoda konečných prvků v geomechanice: Teoretické základy a inženýrské aplikace, předpokládaný rok vydání (2015)
[6] USDA 1951. Soil Survey Manual. Soil Conservation Service. U.S. Department of Agriculture Handbook No. 18. US Government Printing Office. Washington DC.
[7] Wösten, J.H.M., et. al. 1998. Using existing soil data to derive hydraulic parameters for simulation models in environmental studies and in land use planning. Final Report on the European Union Funded project. DLO Winand Staring Centre. Report 156, Wageningen, NL. p. 106. ISSN 0927-04537.